The Chapter 1 film · Health Information Systems · South African narration, captions on
The Journey of a Signal
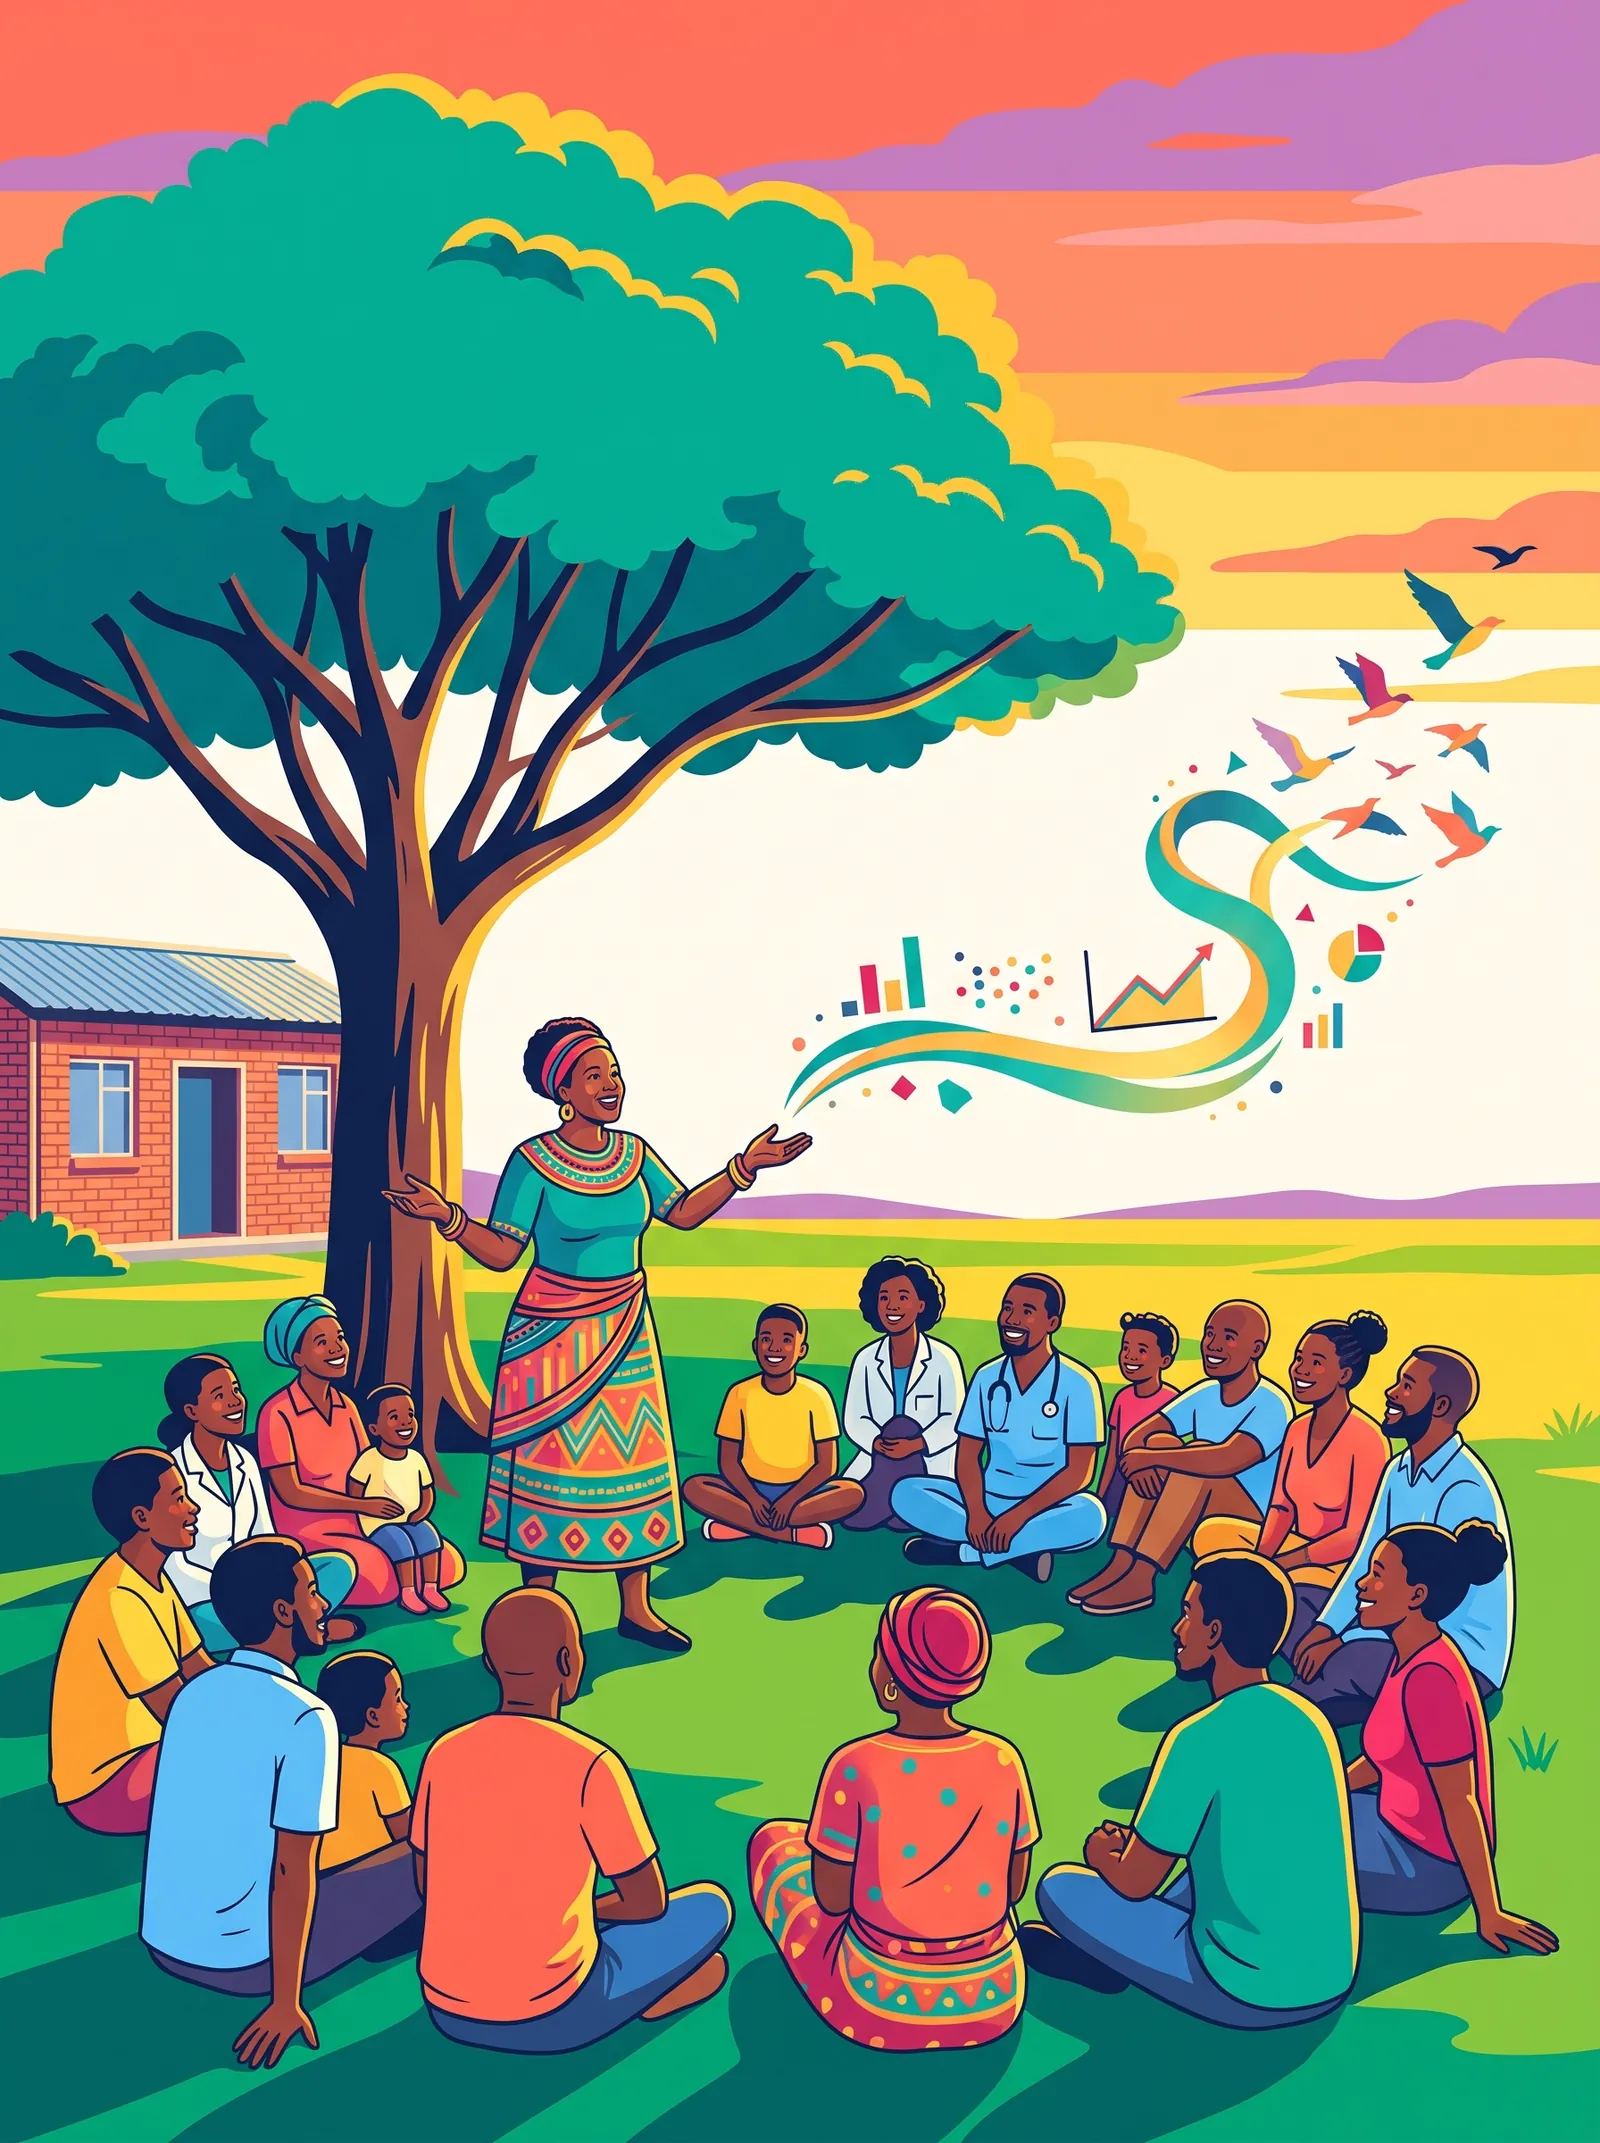
The film for Chapter 1, Health Information Systems: the routine information system as the living body of the district, and the journey a single signal makes from the moment of care, through the system, and back into action. It shows what a learning district is made of, and why the plumbing matters. Narrated in a South African voice, with captions on by default.
Read the transcript
Imagine coordinating healthcare across this landscape. Modern medical delivery spans from high-speed urban hubs to remote villages cut off by mountain ranges and flooded roads. To manage this, we've built massive digital networks. Health workers now collect more data points every single day than at any other time in history. Yet during a health crisis, the system often struggles to see what is happening.
This happens when districts operate as storage units. Nurses spend hours logging thousands of individual data elements into computer systems. That information travels to a national server, enters an archive, and effectively dies there. A health system becomes paralyzed when it fails to use its own information. It gathers endless evidence of its problems while remaining unable to feel or address them.
A health district functions like a single biological organism. This perspective explains why even the most data-rich systems can leave their patients behind. If a numb hand rests on a hot stove, the skin will blister and burn. The hand stays completely still because the nerves are dead. They cannot relay the signal of injury to the brain.
Health districts face the same danger. When the information system fails, the community suffers continuous damage. Outbreaks spread, and stocks of medicine disappear because the system literally does not know it is injured. Data collection without local processing acts like a severed nerve. The sensation occurs on the ground, but the reflex never fires.
The health system maps onto human anatomy. Clinics are the arms, the workforce is muscle, supplies act as circulation, financing provides energy, and leadership is the mind. The routine health information system connects them all, functioning as the central nervous system to integrate every signal. Consider a single signal. A community health worker in a remote village spots a sudden drop in child immunizations.
A pain receptor fires. If this neural pathway functions correctly, the body can react. Without it, the muscles and blood of the system, the staff and the vaccines, remain idle while the injury worsens. That immunization signal travels up the system, but it quickly encounters massive interference. This interference is dangerous data, nice-to-know metrics collected for bureaucratic compliance that consume health workers' energy.
By the time it reaches the district manager, the urgent immunization warning is buried inside an unreadable spreadsheet containing two thousand seven hundred data elements. Fixing this paralysis requires an essential data set. We ruthlessly eliminate administrative noise and focus on a curated list of action indicators. On this lean dashboard, the immunization drop pulses clearly. The signal is finally visible.
Rigorous curation matters more than sheer data volume. Curation is the only way a health system can feel what is happening on the ground. Once the signal is clear, it reaches the facility manager. In our model, this manager represents the spinal cord. Sending data to the national government and waiting for a policy change is slow.
A body touching a hot stove cannot wait for the brain to convene a committee. It relies on a spinal reflex. The local reflex is the PDSA cycle: plan, do, study, act. A manager sees the data, plans a small test, implements it immediately, and studies the result. Local processing allows the manager to reroute a mobile clinic or target supervision within days.
They act on the signal without waiting for top-down permission. This reflex brings medical support to the village before a full-scale outbreak can occur. The system has sensed a problem and corrected it. This learning district responds to its environment in real time. This replaces the old storage unit model, where data was gathered only to be ignored.
Routine data collection provides the necessary signals for local care. Technology empowers the frontline to make decisions instead of simply fulfilling administrative quotas. Stewardship and simplicity transform a fragmented geography into a single responsive organism. When the nervous system works, the district can see, feel, and heal itself.