Information for Action
Curiosity
Chapter 4 · Epidemiological Thinking
The disciplined habit of asking who, what, when, where and, above all, why.
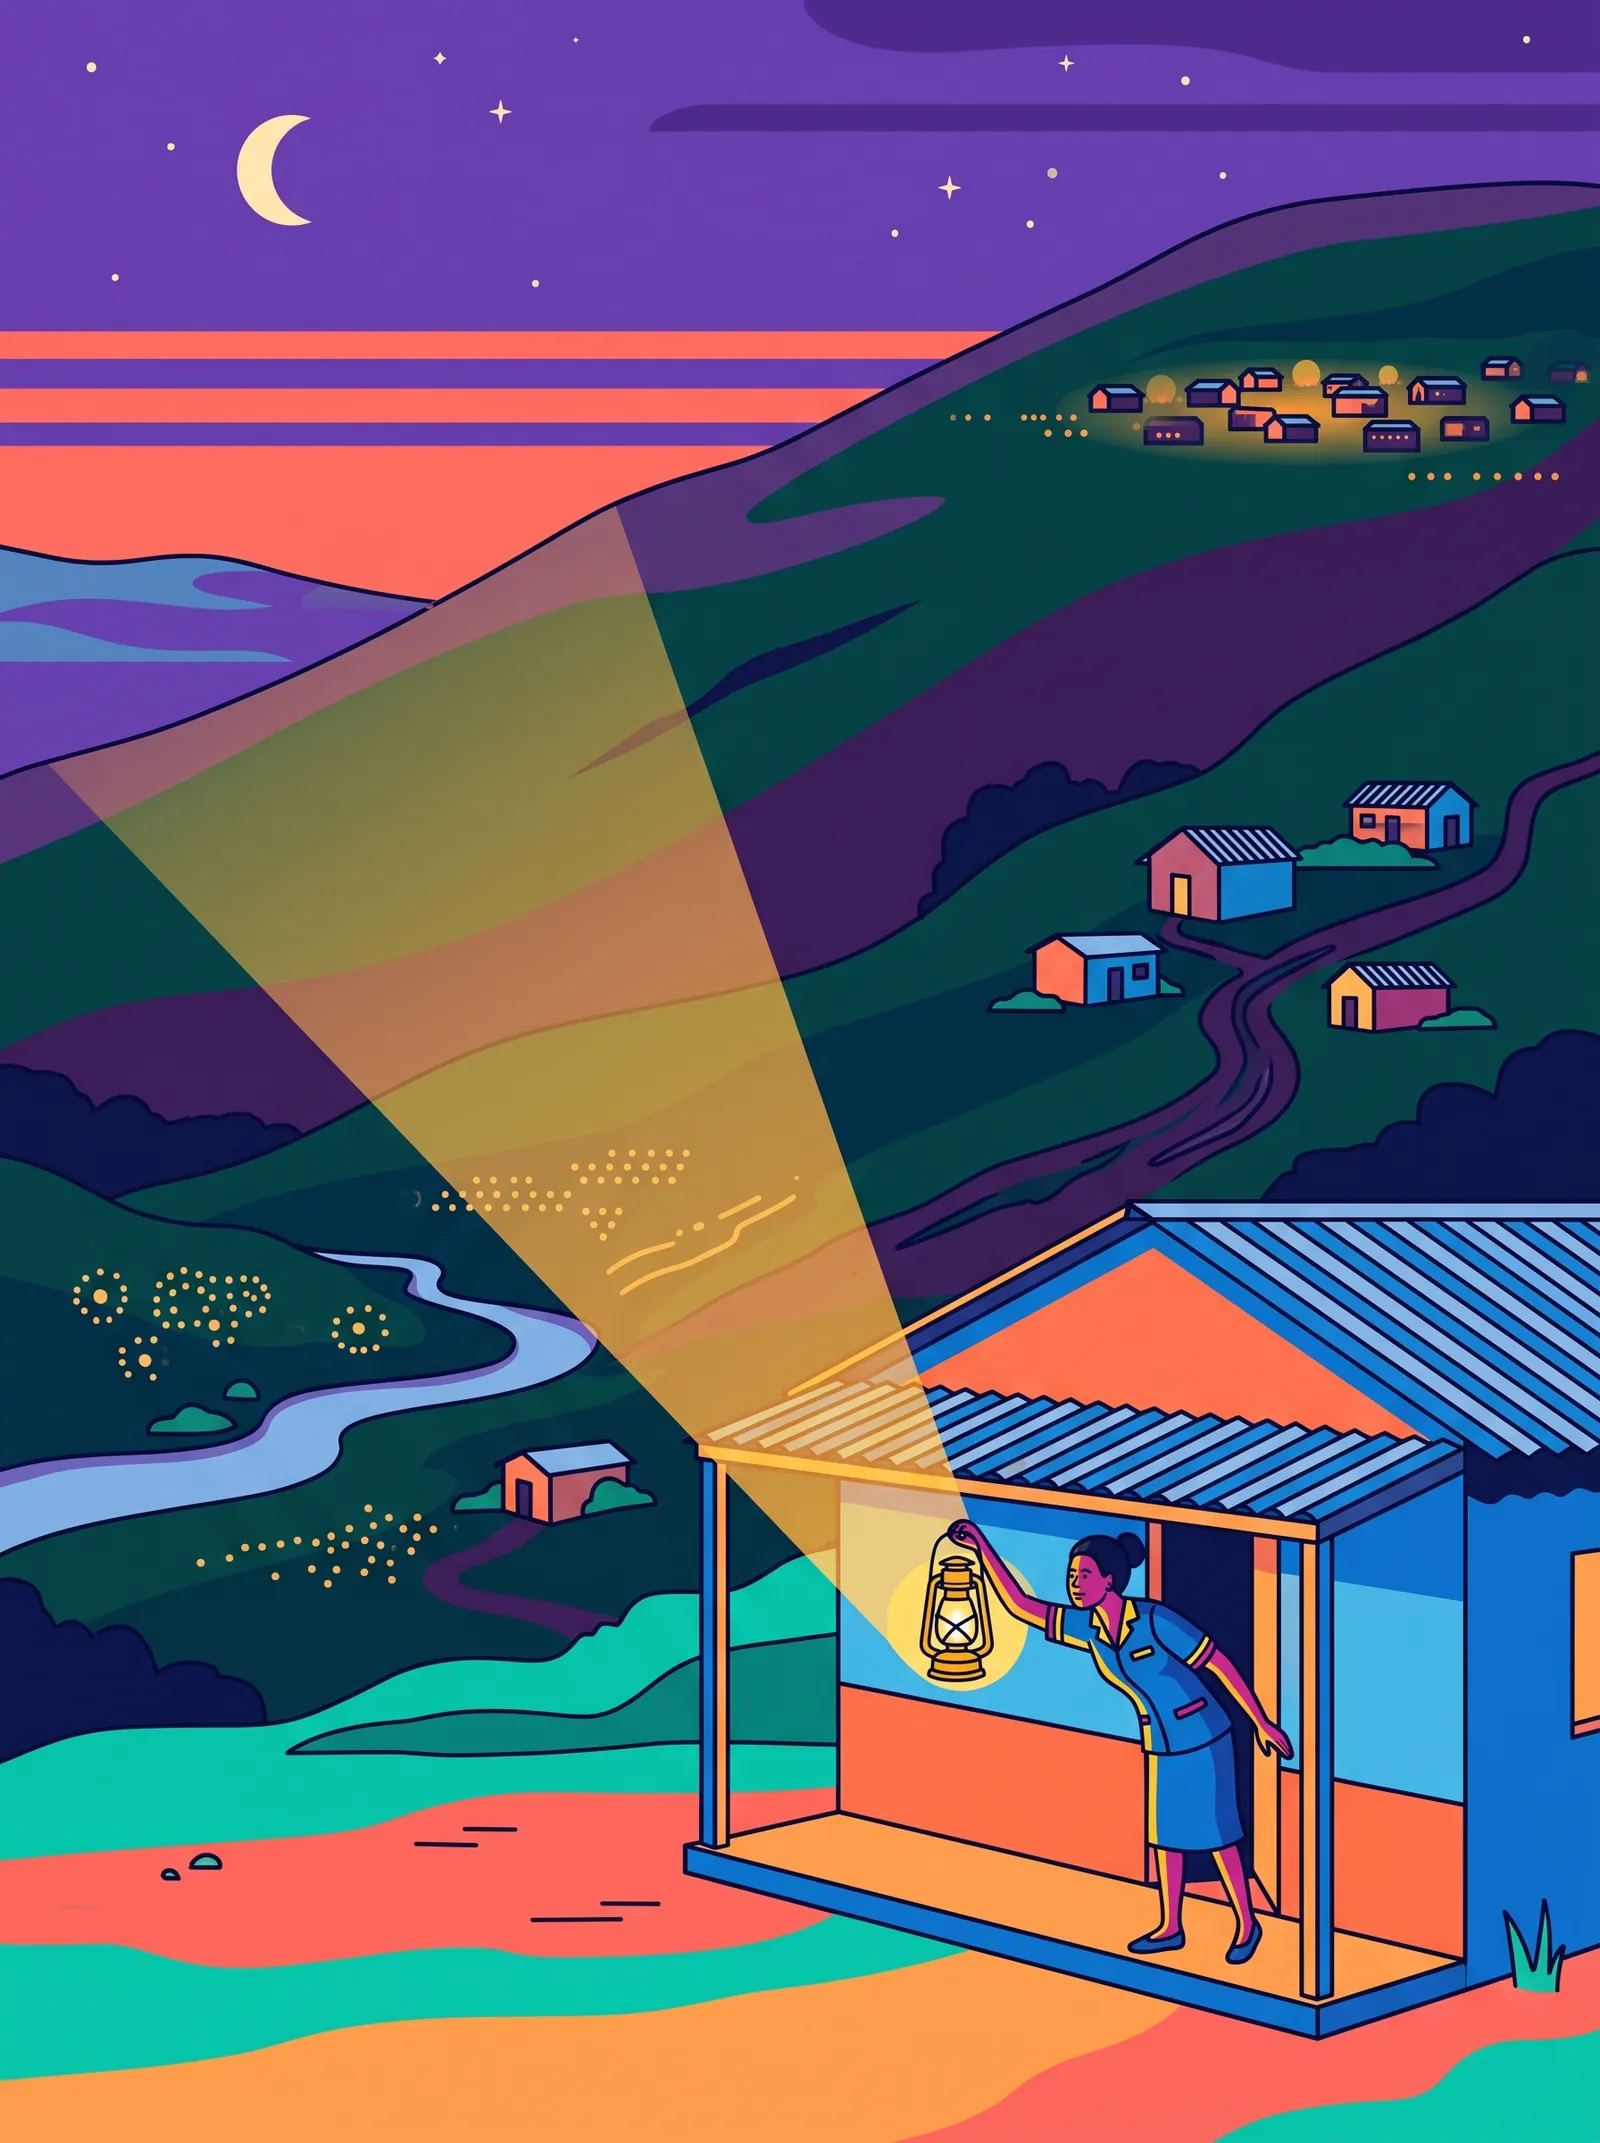
The Public Health Detective, a five-minute film in a South African voice with captions. Watch it on the films page →
By the time you have read this chapter, you will be able to:
- Apply the "Five Ws" (Who, What, When, Where, Why) to any routine health data set, transforming raw numbers into structured questions that lead to local action.
- Calculate and interpret proportions, percentages, rates, and ratios to make fair comparisons between facilities, time periods, or population groups.
- Use epidemiological thinking to investigate a suspected outbreak by verifying data, characterising by time/place/person, formulating a hypothesis, and taking local action.
- Build a culture of curiosity in your team by embedding data questions into routine meetings, encouraging "but why" inquiries, and connecting data to field visits.
Introduction
Data sits in your RHIS like a patient waiting for a diagnosis. It has a story to tell, but it will not speak unless someone asks the right questions. That someone is you. The tools you need are not complex statistics or expensive software: they are curiosity and a structured way of thinking.
This is the essence of epidemiological thinking. It is the disciplined, systematic practice of asking who, what, when, where, and most importantly, why about the health of your population. It transforms you from a passive recipient of reports into an active investigator of your community's health.
For managers at the facility, district, and beyond, epidemiological thinking is the engine that powers the Information Cycle introduced in Chapter 2. It provides the questions that drive data collection (Stage 2), the analytical framework that turns data into information (Stage 3), and the intellectual curiosity that fuels the discussion and interpretation where true insight is born (Stage 5).
This chapter is an invitation to cultivate your curiosity. We will explore how to use the RHIS not just to count, but to understand; to move from seeing numbers to seeing patterns, risks, and opportunities for action. By the end, you will see your data not as a burden, but as a map, one that reveals where your community is healthy, where it is suffering, and where you, as a manager, can make the greatest difference.
4.1 The cornerstone: Why epidemiological thinking matters
Epidemiology is often defined as the study of the distribution and determinants of health-related states in populations. But for a district health manager, it is simpler than that: it is the science of asking good questions about your community's health.
This mindset matters because:
It focuses on populations, not just individuals. A clinician treats one patient at a time. A manager using epidemiological thinking asks: What is happening across all 50,000 people in my district? Who is being left behind?
It quantifies the problem. You cannot manage what you cannot measure. Epidemiological thinking gives you the tools (rates, ratios, proportions) to move from vague impressions ("malaria seems bad this year") to precise statements ("malaria incidence in under-fives has increased by 40% in the northern clinics compared to last year").
It looks beyond the health system. Most illness is driven by factors outside the clinic: water quality, poverty, education, behaviour. Epidemiological thinking pushes you to connect your RHIS data to these underlying social and environmental determinants.
In short, epidemiological thinking is the bridge from routine clinical data and derived indicators to strategic public health intelligence. It is what allows a monthly statistical report to become a compelling story that can change policy, move resources, and save lives.
4.2 The five ws: The questions that unlock your data
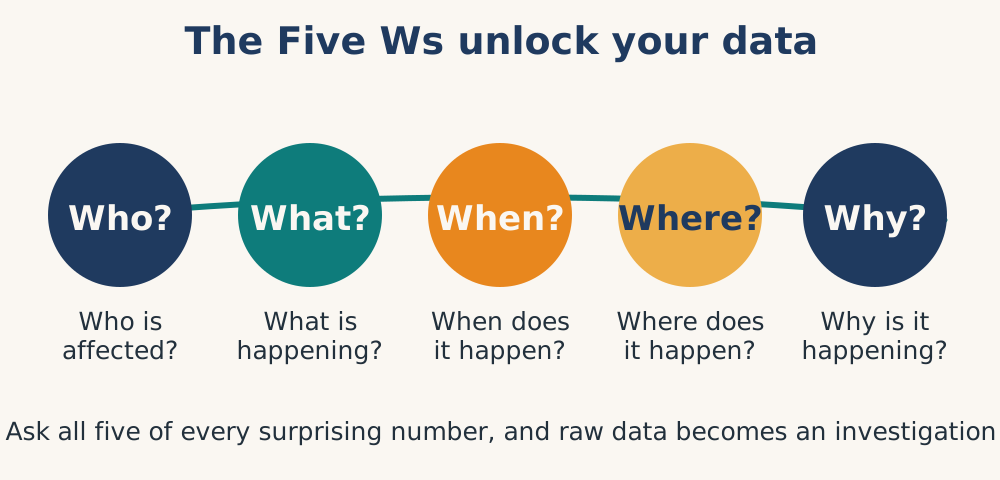
Every good investigation starts with a set of fundamental questions. For the epidemiological thinker, these are the "Five Ws." Your RHIS is designed to capture data that can answer them. The challenge is to make answering them a routine part of your management practice.
| Epidemiological questions | |
|---|---|
| WHO? | Which populations are affected? Age, gender, occupation, risk groups. Numbers of cases by age group or sex. Unique patient identifiers allow for tracking of individuals, co-morbidities, and care pathways. |
| WHAT? | What are the main conditions or health events? Aggregated counts of diagnoses (e.g., 50 cases of pneumonia). Specific disease names, codes, and details of interventions provided. |
| WHEN? | What are the temporal patterns? Seasonality, trends over months or years. Data is normally aggregated and reported by month. Real-time, daily, or even hourly data allows for rapid outbreak detection. |
| WHERE? | Where are the problems concentrated? Geographic hotspots, specific facilities, villages. Data is linked to the reporting facility. Georeferenced household-level data allows for precise mapping of cases and risk factors. |
| WHY? | What are the underlying causes? This is the most complex question. Routine data alone rarely answers "why." It raises the question. Linking RHIS data to external databases (e.g., water sources, weather patterns) can reveal associations. |
The first four Ws (Who, What, When, Where) are the foundation. They tell you what is happening. A manager who masters these can identify a spike in diarrhoea (What) in children under five (Who) during the rainy season (When) in the northern part of the district (Where).
But the final W, Why, is where the true power of epidemiological thinking lies. It is the leap from description to understanding. It requires you to look beyond the data in your RHIS to consider:
Social determinants: Is poverty driving this pattern?
Environmental factors: Is there a contaminated water source in that northern area?
Behavioural patterns: Are there cultural practices or beliefs influencing care-seeking?
The RHIS may not directly answer "why," but it is the starting point. It tells you where to look and what questions to ask when you go out into the community, which is a central part of answering the WHY. Often it is the story of what is happening in the community that discloses the WHY....
4.3 Epidemiological thinking: From curiosity to action
Cultivating curiosity is not an abstract exercise. It has concrete, practical applications that will make you a more effective manager.
Detecting and investigating outbreaks
Example 1
A sudden increase in a single indicator should trigger your curiosity. Why are malaria in children cases spiking in Clinic X when they are stable everywhere else?
This is where your epidemiological toolkit comes into play:
Verify the data: Is it a real increase or a data quality issue? (Trust but verify)
Characterise by time, place, and person: Create a line list. Map the cases. Who is affected? When did they fall ill? Where do they come from?
Formulate a hypothesis: Is it a new mosquito breeding site following heavy rains? A delay in insecticide-treated net distribution? An influx of non-immune populations?
Investigate and act: Deploy a team to the field. Test the hypothesis. Implement control measures, drain the breeding site, distribute nets, spray the houses, activate community health workers for active case finding.
Your curiosity, sparked by a routine RHIS report, has now led to a direct public health intervention.
- Investigate and act: Form a group discussion with these young girls. Discover that there is a new construction site being developed and there have been more men with disposable income. Action includes increasing condom distribution, providing emergency contraception and drugs to prevent HIV transmission. Create an adolescent group that meets weekly also including family planning service and STI treatment in a more contained area to avoid everyone knowing private details about the adolescents.
- Formulate a hypothesis: There has been a change in socio-economic conditions, with more young adults having an earlier sexual debut.
- Characterise by time, place, and person: Map the cases. When did this start? Where are these pregnant women coming from, is it spread around, or limited to one area
- Verify the data: Is it a real increase or a data quality issue? (Trust but verify)
There is a spike in Antenatal clients HIV positive rate in the age group 15 to 24 over the last 6 months.
Example 2
4.4 The language of epidemiology: Making comparisons
To ask good questions, think like a manager and speak the language of comparison.
Raw numbers, like "50 cases of diabetes", are meaningless without context. Is 50 a lot? For a population of 500, yes. For a population of 5 million, no.
Epidemiologists use three simple tools to make fair comparisons between different months, facilities, or districts: proportions, rates, and ratios.
| Term | Description | Example |
|---|---|---|
| Proportion | Numerator is part of the denominator. Tells what share of the problem pneumonia represents. Usually expressed as a percentage. | Proportion of under-five deaths due to pneumonia. (Child with pneumonia death (0 to 4 years)/ Death (0 to 4 years) x 100. |
| Rate | Numerator is part of the denominator. Time-related frequency of an event in a population, this can measure risk | Malaria incidence rate. (New malaria cases in a month / Population at risk) x 1,000. |
| Ratio | Compares two unrelated quantities. The numerator is not part of the denominator. | Nurse workload ratio. (Patient visits in a month / Nurse-days worked) Bed occupancy. Beds occupied/ Beds available. |
Mastering these three concepts allows you to move from asking "how many?" to asking "how many, relative to something else?" This is the heart of comparative analysis and the foundation for setting priorities.
Rates to real numbers for facilities
At the same time we need to convert percentages into numbers so that facility staff understand the actual numbers of clients needed to achieve improvement.
For example, in a facility serving 10,000 people, there are ~400 children <1 yr. If the current coverage is 55% (210 children a year or 18 a month) and you want to increase to 75%, this means that you have to do 300 immunisations, an additional 90 children a year or 8 additional immunisations a month.
4.5 A culture of curiosity: Making epidemiological thinking routine
Epidemiological thinking is not an event; it is a habit. It is the culture of curiosity and critical thinking in a health system that is constantly learning and improving.
How do you, as a manager, cultivate this culture?
- Start Every Meeting with a Question: Instead of just reviewing reports, ask the team: What surprised you in this month's data? What pattern do you see? What question does this raise for us?
- Use the Five Ws as a Checklist: When reviewing a dashboard, consciously go through the questions. Who is affected? What is the condition? Where are the hotspots? When did this start? Why do you think this is happening? Make it a mental routine.
- Encourage "But Why" Questions: When a staff member presents a finding, ask them why they think it is happening. Even if they are not sure, the act of hypothesising is the first step to understanding.
- Go Beyond the Facility Walls: Use your data to prompt field visits. If the data shows a problem in a specific area, go there. Walk the community. Talk to community health workers and residents. Use your eyes and ears to find the story behind the numbers.
- Celebrate the Investigators: Recognise and reward innovative staff who use data to identify problems and propose solutions. Make curiosity a valued trait.
By embedding these practices, you shift your team from being data reporters to being public health detectives. You build a team that does not just manage the health system: they actively investigate it, understand it, and continuously improve it.
Conclusion
Your RHIS is a powerful tool, but it is just a tool. The true engine of a data-driven health system is the curious, epidemiological, critical-thinking mind that uses double-loop learning. It is the managerial mind that looks at a table of numbers and sees a story; that looks at a map of cases and sees a family or community at risk; that looks at a trend line and asks, "What can we do differently?"
This chapter has given you the framework: the Five Ws, the language of rates and proportions, the power of incidence and prevalence. But the most important ingredient is one you already possess: curiosity and critical thinking. Nurture it. Apply it to your data. Let it guide your self-assessment, your supervision visits, your planning meetings, and your resource allocation.
When you combine the power of the RHIS with the discipline of epidemiological thinking, you stop being a passive collector of information and become an active, curious, and effective leader of your community's health. You unlock the true potential of your data: not just to count, but to understand; not just to report, but to act; not just to manage, but to heal.
CAPSTONE EXERCISE: The curiosity investigation
Task: You have been asked to present a 5-minute "data story" at your next staff meeting or district review. Choose one indicator from your facility or district that tells an interesting story.
Using everything from this chapter, prepare a one-page story outline that includes:
- The hook: What caught your attention? (One sentence.)
- The Five Ws: Who?, what?, when?, where?, with specific numbers.
- The comparison: A rate, proportion, or ratio that makes the numbers meaningful.
- The "why": Your best hypothesis (even if not proven) about what is driving the pattern.
- The action: One specific local action you are recommending based on this story.
Then: Treat that action as a small test. Plan how you will know if it worked within 30 days. Tell your audience: "We will try this for one month, study the results and then report back on what we learned."
Output for Capstone: One page. Practice telling it out loud in under 5 minutes. Present it to a colleague and ask: "Did this make you curious?"
References
- Vaughan, 1989
- Vaughan, 1989
- Unger, 1992
- Nakuru County study, 2025
- Universitas Airlangga (UNAIR), 2025
- Vaughan, 1989
- Vaughan, 1989
- Unger, 1992
- World Health Organization, 2023
- MEASURE Evaluation, n.d.