Information for Action
The rhythm of the year
Chapter 9 · Planning, Monitoring and Evaluation
A monthly and quarterly rhythm that turns plans into monitoring, supervision and action.

Introduction: From stewardship to action
Chapter 8 introduced data stewardship as the muscle that moves governance. You learned about the district team’s role as active stewards, the three broken processes, change management and the supervision ladder.
Now this chapter builds the practical cycle. Stewardship sets the stage, the monthly, quarterly, and annual rhythms that turn good intentions into action. Here you will learn how to run a monthly self-assessment, a quarterly progress review, and a PDSA deep dive. You will select your 10 action indicators, integrate targeted supervision, and produce a district action plan that closes the loop between planning, monitoring, and evaluation.
By the time you have read this chapter, you will be able to:
- Select 10 action indicators from the national annual plan using the RAVES criteria, and fix them for 12 months.
- Facilitate a monthly facility self-assessment meeting (overview, deep dive, PDSA action plan, feedback).
- Conduct a quarterly progress review where district and facilities together analyse performance and adjust the annual plan.
- Apply the PDSA deep dive method, from “but why?” to hypothesis to small testable action.
- Use targeted supervision (remote first, using PDSA reports; in-person only for persistent problems).
- Produce a district action plan, one page per indicator, that closes the loop between planning, monitoring, and evaluation.
9.1 The PDSA deep dive method: From “But Why?” To testable action
Deep dive provides the understanding, the forensic investigation of why an indicator is off. PDSA (Plan-Do-Study-Act) provides the action, the small, weekly, testable changes described briefly in Chapter 1 that fix the problem
| PDSA Method (see Chapter 1) | |
|---|---|
| Stage | Action |
| Plan | Identify the off-target indicator. Ask “but why?” three times. Make a hypothesis. Write one small, feasible action |
| Do | Identify who will do what, by when, and how. Implement immediately, no waiting for permission. |
| Study | At next month’s self-assessment, compare the indicator’s new value to the old value. Did it improve? |
| Act | If it worked, make the action permanent. If it failed, discard it, refine your hypothesis, and try a different action. |
The steps of a PDSA deep dive
Step 1: Preparation (before the self-assessment)
Having looked at all the action indicators, the information team (facility or district) identifies one action indicator that is not performing. The team does an initial assessment, checks (again) for data quality, and brings in “problem solving” indicators that add value to the main action indicator. Using the past six months of data (or longer if needed). This provides a broader and longer-term perspective (quarterly trend) and allows staff to see patterns hidden in short-term visualisations.
Identify the key problem, find a story, and make a hypothesis for discussion by the wider team.
Example: The action indicator "fully immunised coverage" has dropped by 10%. The deep dive preparation examines other problem solving indicators: coverage of individual antigens, dropout rates, stock status, cold chain failures, adverse reactions, community outreach, vaccine preventable diseases etc., and looks for patterns. They find that Measles antigen drops significantly for two months.
Hypothesis: There is a vaccine supply problem. What is the story behind that? Let’s ask the rest of the team
Step 2: Deep dive (during the self-assessment)
- Pick one action indicator that is not going well.
- Pull in other problem solving indicators specifically related to that lagging action indicators that may suggest why they are lagging ...
- Visualise the data, get a discussion going. Ask the Epidemiological questions. Find the narrative.
Ask the hard question: What is really happening here? Is this problem human, organisational or technical?
- Do not stop at the first answer. Ask "but why?" three times, identify a story (see chapter 7) and produce a hypothesis
Step 3: PDSA action plan (documented and shared)
They then produce the Plan of the PDSA, a small action with clear identification of roles and responsibility, timing, and standards for implementation for the next month.
- Make sure everyone in the room understands what the problem is
- Clarify what actions will be taken, by whom and when. Assign a deadline. Set standards.
- Do not leave the room without clear actions to implement the plan and means to monitor it is happening.
Example: The person responsible for ordering vaccines is on leave this month, no replacement identified, stock records not up to date, deputy stock person identified, vaccine inventory made anew, low stocks ordered, receipt of stock recorded, outreach vaccination planned with community……
Step 4: Feedback and implementation (the month between meetings)
Send a short (1-page max) standardised report to the district supervisor. Tell them your story, what you found, and what you will do.
Also inform the communities you serve. Show them graphics. Share your stories. Get their buy-in. A community that understands the data is a community that helps solve the problem.
The PDSA becomes the focus of activity. The team “does” the activity, “studies” the results, and prepares to “act” for sustainability.
The results are followed up by the supervisors and presented at the next monthly meeting
Step 5: Reinforcement (quarterly progress reviews)
What worked in one facility can be scaled to others. What failed everywhere needs a system solution from the district.
| How PDSA Repairs Planning, Monitoring, and Supervision | |
|---|---|
| Broken Promise | How PDSA Fixes It |
| Planning (shelf-sitting) | The annual plan’s 10 indicators become PDSA targets. Facilities act on them monthly. |
| Monitoring (mechanical) | Monitoring becomes investigation. The staff ask “but why?” find stories and test solutions |
| Supervision (no feedback) | Supervisors ask: “What did you try? What did you learn? How can I help?” |
What success looks like
A facility that uses PDSA to look at its own indicators every month stops being a passive reporter and becomes an active problem-solver.
They do not wait for supervision to arrive. They call the district themselves and tell their story: "Our malaria tests are zero because of a stockout. Please help."
They do not hide their failures. They name them, analyse them, tell stories and fix them.
They do not dread the quarterly review. They come with stories, of success and struggle, and they leave with solutions.
9.2 Action 1: Select action indicators
Why action indicators?
Notice what is at the centre of the definition of stewardship. Not a dashboard. Not software. Not a supervisor on a motorcycle. Only 10 to 13 action indicators (also known as Key Performance Indicators)
Why ten? (It is not fixed ... could be 5, 8, or 13 but must be the minimum possible)
We use 10 because more than that is noise. Less than that misses too much. Ten is the maximum number of figures any human can hold in their head while also running a clinic, filling a register, and comforting a mother. These ten are the frontline information action warriors, the “cabinet” of indicators, the leading figures on the dashboard.
There are many other useful “ problem solving” indicators available in the background (see chapter 3), available at the click of a button, but needed only when an Action Indicator is a problem.
Why the 10 are at the centre: Without agreement on the action indicators, every process uses different indicators and needs different data. With the core of 10, they are the face of the data management process and everyone soon knows and understands them. A facility's monthly self-assessment speaks the same language as the quarterly review, which speaks the same language as the supervisor's phone call.
What the district stewards do?
Sit down as a team. Pull out the national or district annual plan. Ignore 140 of the 150 indicators. Extract the action indicators that RAVES (see chapter 2) : They are
Relevant to the biggest health problems in your district
Actionable at facility level (not a policy indicator)
Verifiable using existing data
Easy for every facility to collect monthly
Sensitive to changes and specific to what they are measuring
What you do not do: Change them every month. That destroys learning. The same 10 indicators stay on the wall for a minimum of 12 months. Negotiate changes with programmes and facilities once a year.
9.3 Action 2: Monthly self-assessment: The engine of monitoring
Most monitoring systems stop at reporting. The facility fills the form. The district receives it. End of story.
Monthly self-assessment changes that. It turns monitoring from a mechanical act into a problem-solving conversation. Facilities analyse their own data every month, not for the district, but for themselves.
Self-assessment: A radical empowerment step
For years, frontline staff have been shovelling data upward, untouched by human thought. Numbers go from register to form to computer, from facility to district to national offices. No one at the facility ever sees the data again. No one asks: What do these numbers mean for us?
Self-assessment changes that. It is a radical step to empower facilities, opening their eyes to the relevance of the data they already produce. The same nurse who fills the malaria register suddenly sees that her own facility's malaria tests dropped for three months, and realises she can do something about it.
The purpose of self-assessment is empowerment of the facility team through self-analysis of the data they produce. That is all.
A few clarifications:
This is NOT a data quality control meeting. If data quality is a known problem, fix it beforehand using standard data quality tools. Do not let quality concerns derail the conversation.
This is NOT a general discussion. The meeting must remain focused on the 10 indicators and in particular, the deep dive topic. Without focus, it becomes a complaint session or a social gathering.
This is NOT a punishment. If the numbers are bad, that is valuable information. The question is not "who is to blame?" but "what can we learn and fix?"
Who should attend? Interested and curious people
The number of interested, curious people will obviously vary according to the size of the facility. At bigger facilities, it should be the facility information team, programme managers, and any other interested staff, laboratory staff, nurses, drivers, cleaners. That is it.
Important: Programme managers and facility in-charges should take responsibility for analysis, not the information officer. The information officer knows the data system. The programme manager knows the clinical reality. You need both. But the programme manager must lead, otherwise the analysis remains technical and never becomes action.
There is no need for everyone to attend if they are not involved or not interested. A bored nurse sitting through a data meeting they do not understand is a waste of everyone's time. Start small. Let the enthusiasts come. The others will join when they see results.
Preparation is the key:
The ultimate purpose of the self-assessment is to come up with an action plan that is implementable at local level. We use the PDSA model, with the addition of stories to spice up the studying.
1) District information team preparation
While facilities can perform self-assessment independently, it will rarely happen without district support. The district's job is not to inspect. It is to enable.
Make self-assessment a fixture on the calendar. Same day each month. Non-negotiable. Time allocated for the team. As routine as data reporting.
Provide adequate resources. Small things make a big difference: internet bundles, paper, drawing paper, snacks. Manpower, materials, money, even a little, shows the district takes this seriously.
Develop a simple standardised template (paper or digital) as a job aid for analysing each of the 10 action indicators.
Automate monthly feedback reports so they are sent the moment data are verified. Facilities can use them immediately during self-assessment. Encourage facilities to cross-check their own numbers against district feedback.
Remind, support, troubleshoot. Do not inspect. Supervisors give feedback when facilities send their self-assessment reports. A silent district kills motivation.
2) Facility preparation
Facility preparation will depend on the size of the facility. Self-assessment is often difficult at small dispensaries with few staff and limited technical skills, but it is always possible to draw a simple graph and look for stories
The facility information team, with technical support from the district if necessary, does the following before the meeting:
Check data quality, recheck and check again. Before the meeting, not during it.
Visualise, analyse and understand all 10 action indicators for the past month. Look at the facility PDSAs for the past few months.
Look at trends over longer periods.Compare to targets. Look at standardised feedback and supervision reports from the district.
Identify strengths and weaknesses. Be honest. Celebrate the wins. Name the gaps.
Look for stories. For each indicator, ask: What is the story here? Why did this go up? Why did that go down?
Do an in-depth analysis of the chosen indicator for the deep dive. Bring in other problem solving indicators. Look at the results of recent supervision.
Make the best presentation you can. Make it interesting with stories, alive with real-life incidents. It does not need to be fancy. A few charts on paper. A whiteboard. A story told aloud. But make it.
Inform all stakeholders of the time, date, and place.
If possible, organise refreshments. A cup of tea changes everything.
The meeting itself (2.5 hours, not a minute more)
The meeting has to be well organised, focused and disciplined
- Overview (60 minutes), Present all 10 indicators. Celebrate the good ones. Spend at least half this time on discussion and stories.
- PDSA Deep Dive (60 minutes), Pick one indicator that is not going well. Do a deep dive and ask “but why?” three times. Come up with a hypothesis.
- Action Plan (30 minutes), Write one or two concrete actions for the next week. Assign who, what, by when.
- Feedback (after the meeting), Make sure all stakeholders are aware of the plan, their part in it and how it will be followed through. Send a 1-page report to the district. Tell your story, what you found, and what you will do.
The challenge
Here is the truth. Most facilities will not start this on their own. They are too busy. Too tired. Too used to being told what to do.
So the district must start it for them. Pick one facility. Just one to start with. The one with the most enthusiastic in-charge. The one with a nurse who is always asking questions. The one with the cleaner who loves computers. Run one self-assessment meeting with them. Show them it works. Then let them show the others.
You have the data. You have the people. You have the 10 indicators.
The only thing missing is the first meeting.
9.4 Action 3: Quarterly progress review (district + facilities)
Preparation: Action indicator overview
This is a most important strategic meeting and needs careful preparation by the district information team, particularly the programme managers involved in the deep dive.
Preparation is similar to a facility self-assessment, with the focus on how the action indicators are performing across all facilities.
The team should go through the entire information cycle with each action indicator, (and necessary problem solving indicators) checking data quality (again!!) making a variety of graphs (to see trends and patterns) plotting maps (equity) making scorecards and league tables and looking for stories.
Bring in whatever other information may be relevant (weather for malaria, weighing activities for nutrition) and combine them all into a comprehensive district-wide analysis, indicator by indicator.
Now find a story for each indicator and condense all this wisdom into a 5-minute (max) presentation.
Not all indicators will have an interesting story every quarter, but all need to be covered.
Give a brief overview of the unremarkable indicators and more depth to the interesting ones
The quarterly deep dive: District + facilities together
After thorough preparation, the district team and facility heads jointly investigate one problem indicator and associated problem solving indicators affecting multiple facilities. This is not a repeat of the monthly facility deep dive. It is broader and more strategic.
| Monthly Facility Deep Dive | Quarterly District-Facility Deep Dive | |
|---|---|---|
| Scope | One indicator at one facility | One indicator across all facilities |
| Question | "What can we fix locally?" | "Why is this failing in many places, and what can the district do?" |
| Output | One PDSA for that facility | District action plan + targeted support list + peer learning |
The meeting itself (3 to 4 hours):
- Action indicator Overview (1 hour):
The district shows the pattern: (scorecard, maps, trends, league tables) How are the 10 indicators performing across all facilities? Which programmes and facilities are not achieving targets (That is a system problem)
One facility presents its own story, success or challenge, using the same action and backup indicators
- Deep dive and analysis (2 hours):
Pick a programme area that is struggling or succeeding and do a deep dive into that. Look for problems, but is not the basis for sustainable overall monitoring.
Look at the relevant Problem Solving indicators (already visualised, mapped)
Do "but why" and other analytic models (Bottle Neck Analysis, PRISM etc) until you hit a real cause (human, technical, organisational), not just "lack of training".
Identify the problem and the actions needed to solve it
Team proposes hypothesis about why this is happening and possible actions
- Make a PDSA action plan (30 minutes)
Plan for the next quarter using local resources. Do not wait for the national office to take note.
How the indicators become action:
Problems are named, analysed, and assigned. Facilities leave with a plan. The district leaves knowing which facilities need follow-up for which indicators . Supervisors have identified which indicators are problematic at their facilities.
Together, the team closes the loop. Facilities act. The district learns. The system improves.
9.5 Action 4: Targeted supervision: Remote, using PDSA reports
Targeted supervision starts with a simple rule: use remote supervision for almost everything. A 15-minute phone call, guided by six months of analysed data, becomes a coaching session, not an inspection.
Only when remote support fails over a prolonged period does the supervisor visit, bringing indicator evidence and a hypothesis, not a 50-item checklist. That is how feedback becomes the ultimate form of learning.
Most facilities do not need a visit.
| The Supervision Ladder (Integrated with PDSA) | ||
|---|---|---|
| Level 1 | Good facilities (no indicators not performing well): | Send standardised feedback. Recognise their performance. |
| Level 2 | Weak facilities (1 to 3 indicators off for 1 to 3 months): | Remote support, phone / WhatsApp. Ask about the PDSA cycle: “You tried checking stock every Monday. Did it work? What is your hypothesis?” |
| Level 3 | Persistent problems (same indicators off 4 to 6 months despite remote support): | Face-to-face visit. Bring data, past PDSA reports, and a hypothesis. |
The Face-to-Face Visit (No Box-Checking, No Blame)
Before: Assemble the evidence, last 6 months of data, self-assessments, PDSA reports.
During: Start with: “Your graphs show X has been low for six months. Walk me through your PDSA cycles.” Listen. Then present your hypothesis. Output: A revised PDSA action plan.
After: Document and follow up remotely.
9.6 Action 5: The district action plan: Making the national plan your own
Every year, the national or provincial annual plan arrives. It contains 150+ indicators. Most are not actionable at the district level, and the national office will not wait for your input. You cannot rewrite the plan, and you do not need to. Fixing the centralised planning system is someone else’s job. What the district steward can do is take what exists and make it work locally.
The district steward’s role
Extract, Pull out the 10 to 13 indicators that actually matter locally. Use the RAVES criteria (Reliable, Agreed, Valid, Easy, Sensitive/Specific).
Negotiate, Once a year, sit with facilities and programmes. Agree on the priorities for the next 12 months.
Fix them, Do not change them mid-year. Stability enables learning.
Align, Ensure the same indicators appear in the district action plan, monthly self-assessments, quarterly reviews, and supervision check-ins.
Local ownership means you do not wait for the national office to change their plan. You work with what exists, but you make it your own.
The district action plan: One page per indicator
Your district action plan is a simple living document organised around the selected action indicators. It is owned by the district and facilities, monitored by the facilities, and understood by the communities.
Format (one page per indicator):
Visualisation of the trend (from Chapter 6), using other indicators to provide context.
A short narrative story (from Chapter 7) to accompany the graphic, telling the problem or explaining the success and identifying potential action.
Concrete action, PDSA What will the district do next quarter or year to improve this indicator?
Who is responsible? (name or role)
By when? (specific date or month)
How the indicators become action
The district action plan is not a report to file. It is a to-do list that sits on the district coordinator’s desk. It gets reviewed before every quarterly progress meeting.
When the supervisor calls a facility, they open the action plan, know the indicator, and ask: *“What did we say we would do about the stockout indicator? How is it going?”*
That is how a distant national plan becomes a local driver of improvement.
9.7 Closing the loop: PDSA, reviews, supervision, annual plan
When all five elements work together, planning, monitoring, and evaluation become a single closed loop:
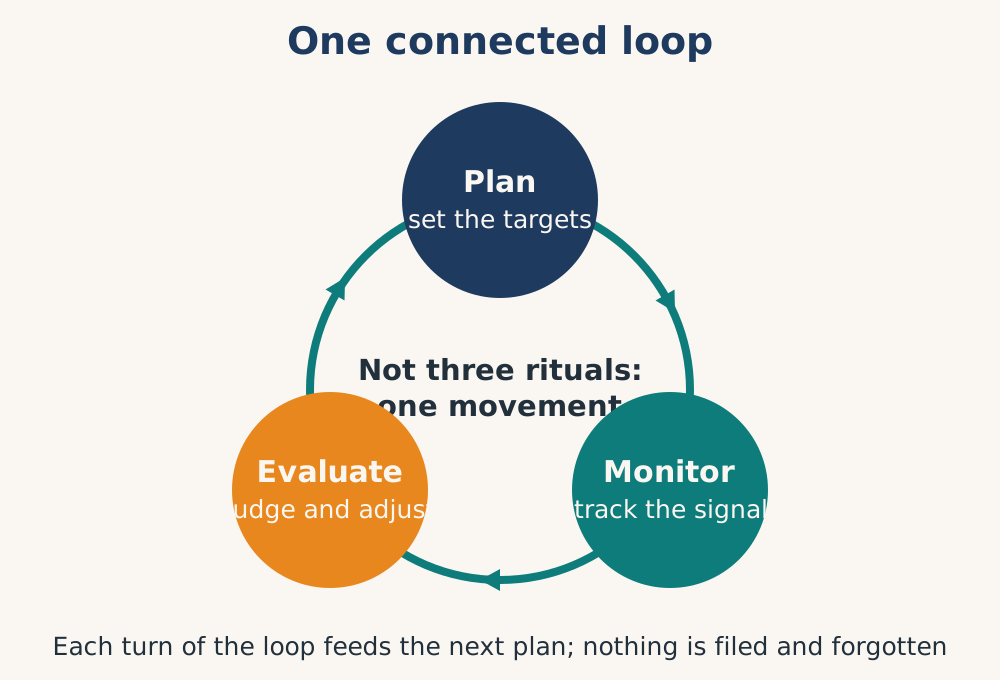
| Activity | Output | Feeds into |
|---|---|---|
| Monthly Facility self-assessment + PDSA | Local action + 1-page report to district | Quarterly review |
| Remote Supervision linked to PDSA | Regular progress reports on facilities needing support | Self assessments Quarterly review |
| Quarterly District, facility progress review | Revised district action plan; identification of systemic problems | Annual plan update |
| Annual Extract 10 to 13 indicators from national plan | District action plan (next year’s to-do list) | Monthly self-assessments |
The test of success: The district coordinator gets promoted. A new person arrives. They do not find a mess of disconnected forms. They find a monthly rhythm of self-assessments, a quarterly rhythm of reviews, and a supervision system that closes the loop. They can run it on day one.
9.8 The prerequisite: A learning environment
You can have the perfect action indicators. You can hold flawless quarterly reviews. You can run remote supervision like a call centre. But if the culture is one of blame, if facilities are punished for bad numbers, then nobody will tell the truth. The data will be cooked. The action plan will be fiction.
The practical cycle in this chapter works only if staff feel safe to fail, learn, and try again. Chapter 10 shows you how to build that learning environment, where the same action indicators become tools for curiosity, not compliance. Where a facility can say “we failed” and the district says “tell us more, how can we help?”
That is when planning, monitoring, and evaluation finally become a single, seamless loop. And that is when information finally, fully, becomes action.
References
- World Health Organization, 2023
- Scoping review, 2023
- Avan, 2016
- Efoulan Health District study, 2026
- Tanzania audit-by-issue study, 2026
- World Health Organization, 2023
- World Health Organization, n.d.
- Burkina Faso nutrition data study, 2025
- World Health Organization, n.d.
- Routine Health Information Network (RHINO), n.d.