Information for Action
From information to action
Introduction
Why this book exists, who it is for, and the eleven-chapter journey from data to action.
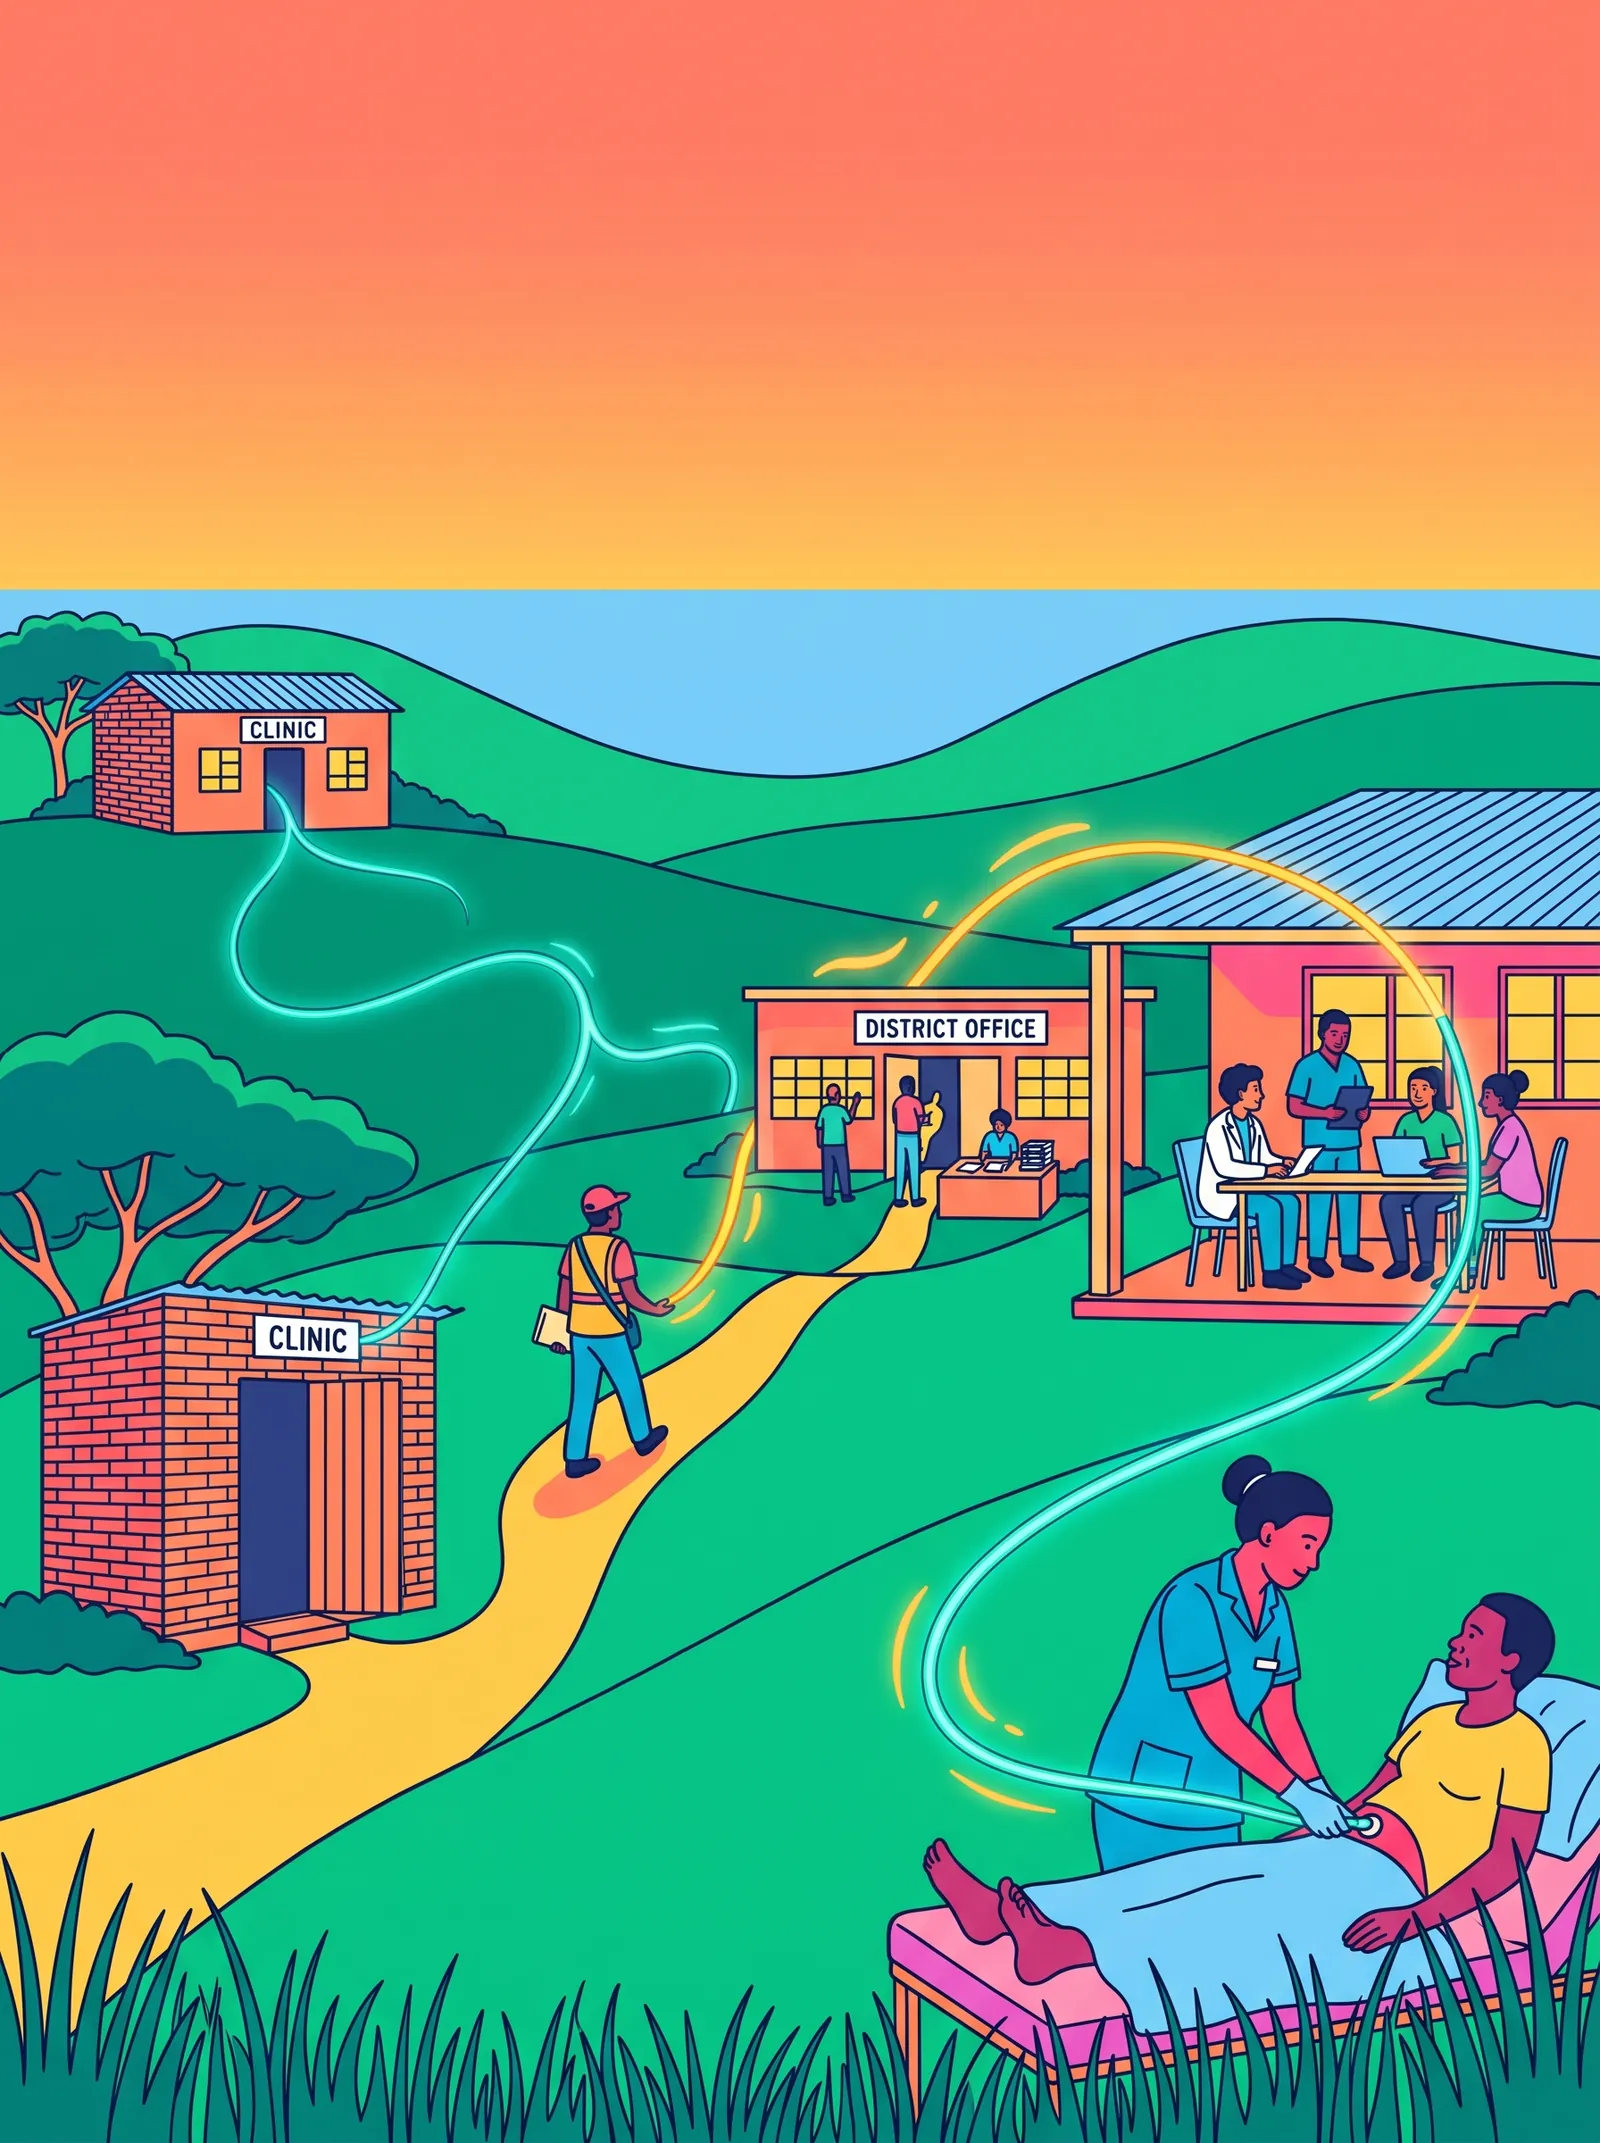
By the time you have read this introduction, you will be able to:
- Identify whether your health information system is a “storage unit” collecting dust or a “learning system” driving action.
- Understand the eleven-chapter journey and how each chapter builds on the last to transform your district health information system (DHIS), using Fruit district as a model
- Recognise the three core ingredients of a functioning RHIS: simplicity, curiosity, and stewardship.
- Articulate why this book exists: to empower you, your team, and your community to use the data you already collect.
1. Who this book is for
This book is for frontline health managers, the people running Primary Health Care (PHC) services in districts, facilities, and communities.
This book is for the doers, the doubters, and the dreamers in primary health care.
It is for you, the district health manager staring at incompatible dashboards, wondering why the numbers never add up.
It is for you, the facility nurse who spends hours entering data that no one ever looks at.
It is for you, the community health worker who sees the real story in the village, the one the registers never capture.
It is for you, the programme manager, tired of hearing “the system won’t let us” when you know it could do so much more.
This book is for frontline health managers, the people running Primary Health Care (PHC) services in districts, facilities, and communities. You are the ones who plan, monitor, and supervise health services. You face the daily reality of stockouts, staff shortages, and impossible workloads. And you are the ones who can make the biggest difference, with the right balance of people, structures, and technology, the right epidemiological and analytic tools and a curious, enquiring mindset.
You are the ones who plan, monitor, and supervise health services.
You face the daily reality of stockouts, staff shortages, and impossible workloads.
And you are the ones who can make the biggest difference
All you need is the right balance of people, structures, and technology, the right epidemiological and analytic tools and a curious, enquiring mindset to ask the right questions.
You already have the data. This book shows you how to use it.
2. The RHIS journey: From information to action
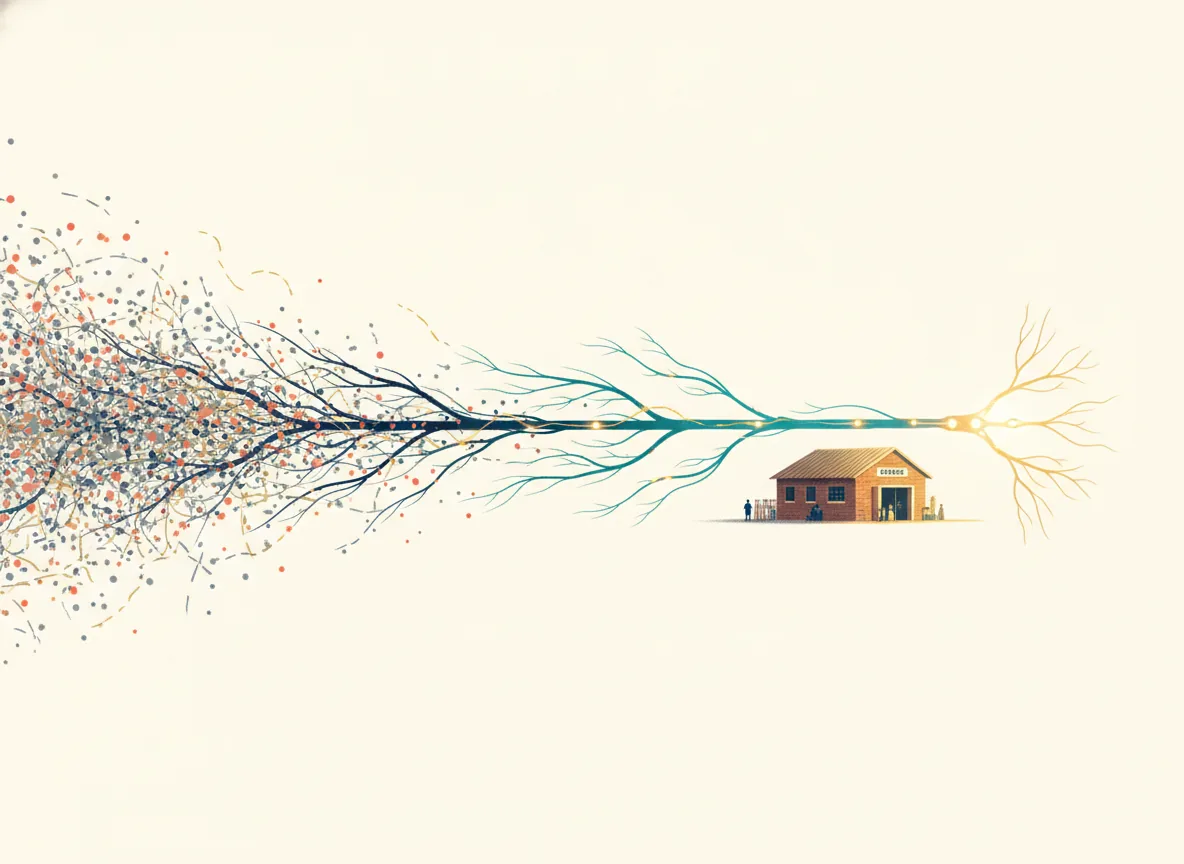
Think of this book as a journey from information system noise, the overwhelming flood of raw numbers, to nerve: a clear, purposeful system that senses, understands, and acts.
Act I: Foundation and mindset (Chapters 1 to 5)
Learning to see clearly.
Chapter 1: Introduction to Health Information Systems. The RHIS as your “central nervous system”. Map your data flow. Five RHIS principles. Six WHO building blocks.
Chapter 2: Data Use. The information cycle. Five self-assessment questions: Is this good data? But why? What’s the real story? So what? Now what?
Chapter 3: Design for Performance. The PRISM framework. The truth: every system produces exactly what it was designed to produce. Balance people, structures, and technology.
Chapter 4: Epidemiological Thinking. The Five Ws: Who? What? When? Where? Why? Build a culture of curiosity. Calculate rates, proportions, and ratios.
Chapter 5: Collection. The Five Cs: Correct, Complete, Consistent, Current, Confidential. Hybrid paper-digital systems. Collect less, only what you use.
Act II: Making meaning (Chapters 6 to 7)
Learning to speak truth.
Chapter 6: Visualisation. The golden rules. Hand-drawn graphs. GIS maps. Scorecards. Dashboards that reveal, not confuse.
Chapter 7: Stories for Action. The three-act structure: beginning (context), middle (tension), end (resolution). Push, pull, and dialogic feedback. Traditional storytelling empowers communities.
Act III: Sustainability and scale (Chapters 8 to 11)
Learning to build systems that last.
Chapter 8: Data Stewardship. Governance (skeleton) versus stewardship (muscle). Five stewardship actions: select indicators, enable self-assessment, run quarterly reviews, targeted supervision, produce a district action plan.
Chapter 9: Planning, Monitoring and Evaluation. Step-by-step protocols for monthly self-assessments, quarterly reviews, PDSA deep dives, and supervision.
Chapter 10: Building Learning Health Systems. Single-loop and double-loop learning. Build weekly, monthly, quarterly analysis rhythm. University partnerships for accredited distance learning.
Chapter 11: Digital Health and Informatics. The digital architecture as connective tissue and circulation. The Provincial Health Data Centre. Interoperability. POPIA. The path from paper to digital. Artificial intelligence as a partner, not a replacement.
Introduction to the exercises: Learning from Fruit District (example 1)
Fruit District (Example 1) is not a real place, but its problems are. Staff are overwhelmed by 2,700 monthly data elements, yet no one looks at most of them. Remote facilities are forced to submit data by motorbike because the internet fails, while well-resourced clinics collect the same 150 indicators. Denominators are outdated, registers are missing, and excessive data is reported upward for donors and bureaucrats but never used locally.
The exercises that follow show how applying the information cycle, deciding what data you truly need, visualising it simply, asking "But why?" and closing the loop with action, can transform this chaos into stewardship, using common sense, not expensive software, to make data work for the people who collect it.
In Fruit District, as in your district, growth and learning, like fruit, take time, patience, and the right conditions.
3. The body analogy
Throughout this book, the health system is seen as a living body.
Service delivery = arms and hands
Health workforce = muscles
Medical products = organs and blood
Health financing = metabolic energy
Leadership and governance = mind and will
The health information system = the central nervous system
When the nervous system works, the body senses injury, learns, adapts and acts.
When it fails, the body is numb. It cannot know if it is injured, cannot know if treatment works, cannot know if it is healing.
This book makes your central nervous system work.
4. Why this book exists
We are living in a paradox as outlined in Fruit District.
Never have we collected so much information. And never have we been so information-poor when it really matters.
The district manager cannot explain why immunisation dropped, the nurse spends hours entering data no one uses, and the community health worker knows the real story, but no one asks her.
The district is full of RHIS policies, plans and promises that are not implemented because the organisational, human and technical components are not balanced.
Routine reports are full of raw data that nobody reads, use metrics that are meaningless, and reward compliance over curiosity and innovation.
Supervision is a routine chore that inspects rather than teaches.
Planning is done by national level bureaucrats and donors and ignores local realities.
This book offers a rigorous, humane alternative by empowering health workers to do basic analysis using indicators and closing the feedback loop by telling stories.
The cost of not learning? Missed outbreaks. Failing services. Burnt-out teams. Apathetic communities. Lives that could have been saved.
The three core ingredients for a successful RHIS
- Simplicity: keeping the system human. Less is more. Collect only what you use. The most common problem is too much data, not too little. Focus ruthlessly on the "must-know" action indicators and use the most simple technology that works.
- Curiosity: turning numbers into questions. The best system is useless if no one asks questions. "But why?" is more powerful than any dashboard. Epidemiological thinking, asking who, what, when, where, why, is the engine that drives the information cycle. Double loop learning questions the system and curiosity drives constant improvement.
- Stewardship: health workers taking ownership. Data systems don't run themselves. They depend on people who take responsibility, the nurse who loves numbers, the cleaner good with computers, the data clerk never listened to. This book shows you how to find and empower them and build sustainable systems that keep the wheels turning even in bad times.
5. Two districts: Storage vs. learning
District A: The storage unit
Data is collected because someone in authority demands it. Submitted because "the district will call if I'm late." But no one sees it again. No one analyses it. No one asks what it means.
The manager receives reports. She transmits raw data then files them. She can't explain why coverage is low or what to do about it.
Supervisors check fridge temperatures and cleanliness. They never look at facility data. No feedback. Nothing changes.
District A collects information, but it does not learn.
District B: The learning system
Data is collected because someone needs it. The team gathers curiously around a hand-drawn graph. They celebrate wins and investigate gaps. They ask: "What surprised us?"
They do deep dives. They ask “but why?” three times. They test small PDSA cycles. They document what they learned. They share stories.
The manager uses the same indicators for planning, monitoring, supervision. She calls struggling facilities to ask: “What help do you need?”
When a staff member leaves, the new person finds a folder with six months of reports, deep dives, and PDSA documentation. They don’t start from zero.
District B collects information and acts on what it learns.
6. What this book will not do
This book will not make you a data scientist. You need curiosity, disciplined questioning, and courage to act.
This book will not give you a one-size-fits-all prescription. Every district is different. We give frameworks, not formulas. You adapt them to your local needs.
This book will not solve everything overnight. Building a learning system takes time. PDSA cycles will fail. You will learn from every failure.
This book will not replace your national HIS. We ask you to use existing data, in existing systems, to improve existing services through stewardship.
7. How to use this book
Read it actively. Each chapter ends with exercises. Do them. They are not optional. They take you from theory to practice.
Start small. Pick one chapter, one exercise, one change. Run it for a month. See what happens. Learn. Do it again.
Share it. Read with your team. Discuss exercises together. Use it as a training manual. Discussions matter as much as the material.
Refer back. Keep it on your shelf. Come back when stuck. Frameworks and exercises will be waiting.
8. The promise
You now have the blueprint.
Chapters 1 to 5 are your eyes: seeing clearly through simplicity and curiosity.
Chapters 6 to 7 are your voice: speaking truth through visualisations and stories.
Chapters 8 to 11 are your engine: building systems that last.
Your district is not waiting for a better dashboard. It is waiting for you: equipped, motivated, and holding eleven chapters of hard-won clarity.
The work won't be easy. Staff are tired. Resources are scarce and computer systems are complicated. The national system won't always cooperate.
But you have something better than resources: people. Curious, dedicated, empowered people who want to do better. They are already collecting data. They are already doing the work. Give them the opportunity to work as teams, to understand the context and tell meaningful stories.
Your job is to help them see that their work matters. Your job is to help them use data to make local decisions. Your job is to tell stories that inspire action. Your job is to build a system that learns from every success, every failure, every surprise.
The learning district is already late for its own revolution.
9. References
There are references attached to each chapter. These come mainly from the sources outlined below.
Core organisations and platforms
| Organisation | Website | Key Resources |
|---|---|---|
| World Health Organization (WHO) | iris.who.int | RHIS Toolkit, DQA Toolkit, Health System Building Blocks |
| MEASURE Evaluation | measureevaluation.org | PRISM Tools, RHIS Assessment Tools, DQA Tools |
| RHINO (Routine Health Information Network) | rhinonet.org | RHIS Resources, Community of Practice, Tools and Guidance |
| DHIS2 | dhis2.org | Data Visualisation, Dashboard Configuration, Training Materials |
| Health Data Collaborative | healthdatacollaborative.org | PRISM Tools, Data Quality, Country Support |
| PubMed | pubmed.ncbi.nlm.nih.gov | Peer-reviewed articles, Systematic Reviews, Research Studies |
Quick Search Guide. To find any reference quickly:
WHO Publications: go to iris.who.int and search the title.
PubMed Articles: go to pubmed.ncbi.nlm.nih.gov and search the title or author.
MEASURE Evaluation Tools: go to measureevaluation.org and search the tool name.
RHINO Resources: go to rhinonet.org and browse the resource library.
DHIS2 Documentation: go to dhis2.org or docs.dhis2.org.
10. Self-assessment: Where is your district today?
Answer honestly. This gives you a baseline to see where you started.
Data use:
Used for local planning, or only upward reporting?
Do frontline staff see feedback, or does data disappear?
Simplicity:
How many data elements do you collect monthly?
How many do you actually use?
Are tools user-friendly or overwhelming?
Curiosity:
Does data discussion only revolve around data quality and who to blame, or is it a monologue?
When you see an unexpected number, does someone ask “why”?
Stewardship:
Do you have an information champion with protected time?
Do supervisors use data, or still a checklist?
Learning:
Do you test small changes and document what happened?
If your best staff left tomorrow, would their knowledge leave with them?
Write your answers. Keep them. Come back after reading this book. See how far you’ve come.
11. The road ahead
| Chapter | Content |
|---|---|
| 1 Introduction to Health Information Systems | Central nervous system analogy. Map data flow. Five RHIS principles. Six WHO building blocks. |
| 2 Data Use | Information cycle. Five self-assessment questions. Action indicators. RAVES model. |
| 3 Design for Performance | PRISM framework. Information champions. Decentralisation. Virtuous cycle. |
| 4 Epidemiological Thinking | Five Ws. Proportions, rates, ratios. Incidence vs. prevalence. Culture of curiosity. |
| 5 Collection | Five phases. Facility Profile. Hybrid flows. Five Cs of data quality. |
| 6 Visualisation | Golden rules. Hand-drawn vs. computer graphs. GIS. Dashboards. |
| 7 Stories for Action | Data storytelling. Narrative arc. Feedback mechanisms. Community empowerment. |
| 8 Data Stewardship | Governance vs. stewardship. Five actions. Change management. Supervision ladder. |
| 9 Planning, Monitoring and Evaluation | Action indicators. Monthly self-assessment. PDSA. Quarterly reviews. Supervision. |
| 10 Digital Health and Informatics | Digital architecture. PHDC. Interoperability. POPIA. Paper to digital. AI as a partner. |
| 11 Building Learning Health Systems | Single vs. double-loop learning. Five documents. University partnerships. |
Now turn to Chapter 1.
The journey begins.
“Every system produces exactly the results it was designed to produce. If your data is poor, if it goes unused, if frontline staff see it as a burden, these are not accidents. They are the predictable outcomes of a system designed for compliance, not for learning.”
From Chapter 3: Design for Performance
Example 1 Fruit District profile:
The district is named Fruit District to remind everyone that growth and learning, like fruit, take time, patience, and the right conditions.
Overview
Fruit District is a rural district in a low- to middle-income country with a population of approximately 150,000 people spread across 2,500 square kilometres. The district ranges from lowland plains (mango and banana cultivation) to hilly terrain (papaya and citrus). The rainy season (November, March) brings flooding that often cuts off roads to some Southern clinics and remote villages.
The district headquarters is located in the central town of Mango. The population is young, with high fertility rates and a significant burden of communicable diseases, particularly malaria, tuberculosis, and childhood infections.
Total Population: 150,000
North 60,000 Flat, good roads, reliable internet
Central 45,000 Mixed terrain, good roads, reliable internet
South 45,000 Mountainous, large river, 3 dispensaries inaccessible 4 months/year, poor roads, unreliable internet
Health system structure
| Level | Staff | Services |
|---|---|---|
| CHW (80) | CHW | Health education, community-based malaria testing, family planning promotion, referrals, home visits, data collection |
| Dispensary (10) | Nurse | OPD 0 to 4 years curative, weighing, immunisation, ANC, malaria testing. CHW support |
| Health Centre (4) | Midwife EHO, Lab, | Deliveries, ANC, immunisation, OPD, nutrition, malaria Support to dispensaries & CHWs |
| District Hospital | Doctor, Pharmacist | Emergency, surgery, maternity, Caesarean Section, inpatient, laboratory, pharmacy, Xray |
Transport infrastructure
| Vehicle | Outreach | Supervision |
|---|---|---|
| Motorbike 1 (Cherry HC) | Western route (Guava, Lemon, Lime, Olive, Date) | Western and Northern: Date, Guava, Lemon, Lime, Olive, |
| Motorbike 2 (Guava HC) | Eastern route (Papaya, Coconut, Avocado, Grape, Fig) | Eastern and Southern: Papaya, Coconut, Avocado, Grape, Fig |
| Vehicle (Hospital) | Used for transport of drugs, supplies and staff when/as needed | |
| Ambulance (Hospital) | Emergency / Mobile outreach: Central facilities (Mango, Orange, Banana, Pineapple, Passion) | Central facilities: Mango, Orange, Banana, Pineapple, Passion |
District health management team (DHMT)
| Position | Responsibility |
|---|---|
| District Health Manager | Overall leadership |
| MCH Coordinator | ANC, delivery, immunisation, nutrition |
| Malaria Programme Coordinator | Malaria prevention, testing, treatment |
| TB/HIV Coordinator | TB/HIV testing, treatment, retention |
| Data/Information Officer | RHIS, data quality, dashboard |
| Logistics Officer | Supply chain, stock management |
| Environmental Health Officer | Sanitation, water quality |
Key health challenges
| Challenge | Detail |
|---|---|
| Malaria | Leading cause of morbidity/mortality; peak Dec to April; southern/western areas highest burden |
| Maternal Health | MMR ~400 to 500/100,000; facility delivery ~60%; teenage pregnancy significant issue |
| TB Treatment success rate | 55 to 60%; default due to migration and transport barriers |
| Malnutrition | ~30% chronic malnutrition in under-5s; seasonal peaks |
| Immunisation | DPT3 fluctuates 65 to 85%; equity gaps in remote villages |
| Non Communicable Diseases | Emerging hypertension, diabetes, respiratory conditions |
The 10 selected action indicators for Fruit District
| Indicator | Target | Why |
|---|---|---|
| 1 DPT3 Coverage | 90% | Immunisation completion |
| 2 ANC 4th Visit Rate | 80% | Maternal health continuity |
| 3 Skilled Birth Attendance rate | 80% | Safe delivery |
| 4 Malaria Test Positivity Rate | <10% | Malaria control |
| 5 TB Treatment Success Rate | 85% | TB control |
| 6 ART Retention at 12 Months | 90% | HIV care continuity |
| 7 Family Planning Uptake (CYP) | Increasing | Reproductive health |
| 8 Stockout Days (Tracer Drugs) | 0 | Supply chain |
| 9 Child with Diarrhoea (0 to 4 years) treated with ORS | 100% | Child health |
| 10 Teenage Pregnancy Rate | Decreasing | Adolescent health |
Information systems
National RHIS (DHIS2) for reporting Data Elements Required Monthly
Dispensary 150 data elements
Health Centre 150 + additional 50 = 200 data elements
District Hospital 150 + additional 50 + additional 1075
0 = 300 data elements
Total data elements collected district-wide monthly: 2,700
CHW data is not incorporated in the system
Data Burden Paradox (District-wide): Date Dispensary (one nurse, 75% vacancy, no internet, inaccessible 4 months/year) must collect the same 150 monthly data elements as Orange Dispensary (fully staffed, good internet, good roads). The system punishes the weakest facilities with the heaviest burden.
Routine Data Meetings
Daily clinical handover meetings
Monthly Data Quality Half day; Facility staff check quality
Quarterly Data Quality Full day; DHMT plus facility heads review data quality across facilities, discussion of data discrepancies, triangulation with other sources
Information Communication technology
All facilities use the same RHIS platform (DHIS2)
Internet provided by different providers ... reliable in North and Central but weak in South. Guava HC, Fig and Date dispensaries cannot send data for weeks at a time; must travel to upload
Every facility has a tablet (donated by HIV/TB programme) so not for general use
Every health centre also has a laptop